
Description
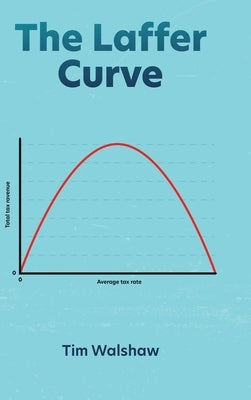
What is the maximum possible average tax rate before tax revenue begins to decline? This is described by the Laffer Curve. On a chart where the 'x' axis is the average tax rate and the 'y' axis is the total tax revenue, you can draw an upside down curve that has a peak at some point. Past that point, tax revenue declines. There is no dispute among economists about the correctness of this theory. The dispute among economists is whether the Laffer Curve exists in practice. This book estimates a mathematical formula for the Laffer Curve, and with that, estimates the maximum possible average tax rate for the USA at a certain date. This information is very useful for policy purposes.
Author: Tim Walshaw
Publisher: Tim Walshaw
Published: 08/19/2020
Pages: 68
Binding Type: Hardcover
Weight: 0.58lbs
Size: 9.00h x 6.00w x 0.25d
ISBN13: 9780648768913
ISBN10: 0648768910
BISAC Categories:
- Business & Economics | Government & Business
- Business & Economics | Economics | Macroeconomics
This title is not returnable